Unfortunately, and still in the XXIst century, micronutrient (MN) malnutrition is a problem in all countries, in all segments of society. While part of the world starves, another part is obese. And a balanced diet is still far from being real for many people. Something to think about…
This is a real public health concern, and policies in this area are aimed at preventing, among others, mild, moderate an severe MN malnutrition. Deficiencies in MNs such as iron, vitamin A (VA), iodine, zinc and folic acid are associated with adverse health outcomes, especially in pregnant women and children. For example, VA is critical for embryonic development, adult growth and development, cellular differentiation, immune function, reproduction and vision. On the other hand, low iron levels lead to reduced physical activity in adults and impaired brain development in children.
Tools to assess MN deficiencies are needed, allowing to screen large segments of population. Biochemical analysis of VA levels include the measuring of retinol or retinol binding protein (RBP) values in serum. In parallel, iron levels can be estimated by measuring ferritin and the soluble transferrin receptor (sTfR). However, ferritin can increase during inflammation, so C-reactive protein (CRP) and α-acid glycoprotein (AGP) are also measured to adjust for the influence of subclinical inflammation.
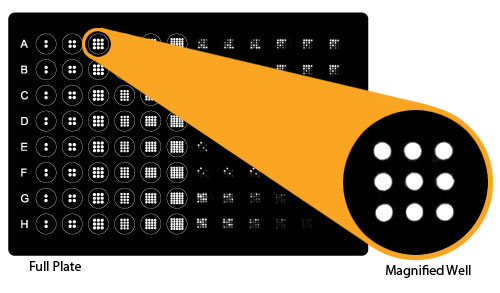
Measuring of these markers is usually done by ELISA. This is a good method if you have enough sample, and if you don’t have to screen a large population. For larger population screenings, and/or if sample volume is limited, multiplex methods are preferable. A recent publication by Brindle et al. describes the development of such a multiplex method for quantification of markers related to inflammation, vitamin A and iron status: α-1-acid glycoprotein, C-reactive protein, retinol binding protein 4, ferritin and soluble transferrin receptor, in serum and plasma samples.

Comparison of the results yielded with this new multiplex methodology were highly correlated to the ones obtained with conventional ELISA (Pearson Correlations of 0.606 to 0.991, p<.0001). Inter-assay imprecision for the multiplex panel varied from 1% to 8% (lower than conventional ELISAs), and all samples fell within the limits of quantification for all assays at a single dilution.
As it usually happens, absolute values given by the multiplex and conventional ELISA assays differed, so the authors indicate that further work is needed in order to devise a new standard curve.
All in all, the authors indicate that this multiplexed micronutrient immunoassay technique has excellent potential as a cost effective tool for use in large-scale deficiency assessment efforts.
Want to test the Q-plex technology used in the development of this custom multiplex assay? Just contact us to get your free demo kit!


