

Download the Application Note
Explore how multiplex antibody arrays streamline protein profiling and biostatistical analysis.
This application note highlights solutions for biomarker mapping and data analysis services.
Introduction
Oxaliplatin (OXA) is a chemotherapeutic drug which causes DNA cross-linking damage, preventing DNA replication and transcription and leading to cell death. Oxaliplatin is known as immunogenic cell death (ICD) inducer and act on dying cancer cells by releasing cytokines that activate the immune system [1].
The analysis of global secretome of OXA-treated cells requires proteomics technology and its combined data analysis to finely understand the effect of the drug on the immune system.
In this context, our laboratory offers, for the pharmaceutical industry, biotechs and academics, a full proteomics service from the cell-based assay to the biostatistical analysis of proteomics data in order to help the researchers to discover or confirm the mechanism of action of their drugs.
Materials & Methods
MCA205 cells were treated with 300 µM OXA for 24 h. Secreted cytokines were analyzed and compared to the untreated cells by using a multiplex antibody array targeting 200 cytokines (Ref. GSM-CAA-4000). Based on these data, biostatistical analysis was performed to evaluate the effect of OXA on the cancer cells.
Data were first normalized and processed to remove any outliers or any data anomalies. Heatmap analysis and principal component analysis (PCA) were conducted using R to unveil underlying patterns and visualize multidimensional relationships within the dataset. Subsequently, differential expression analysis was conducted using t-tests, to pinpoint significant changes in biomarker expression between treated and untreated cells. Finally, Gene Ontology (GO) enrichment analysis was employed to unveil biological processes and pathways associated with the identified biomarkers.
Results
To assess the effect of OXA on cancer cells, we analyzed the secretome of the mouse fibrosarcoma cell line
MCA205 by using the mouse cytokine array GS4000 based on a matched pair of cytokine-specific antibodies for
detection (Figure 1). GS4000 array is a combination of 5 non-overlapping arrays to measure the relative expression levels
of 200 mouse cytokines
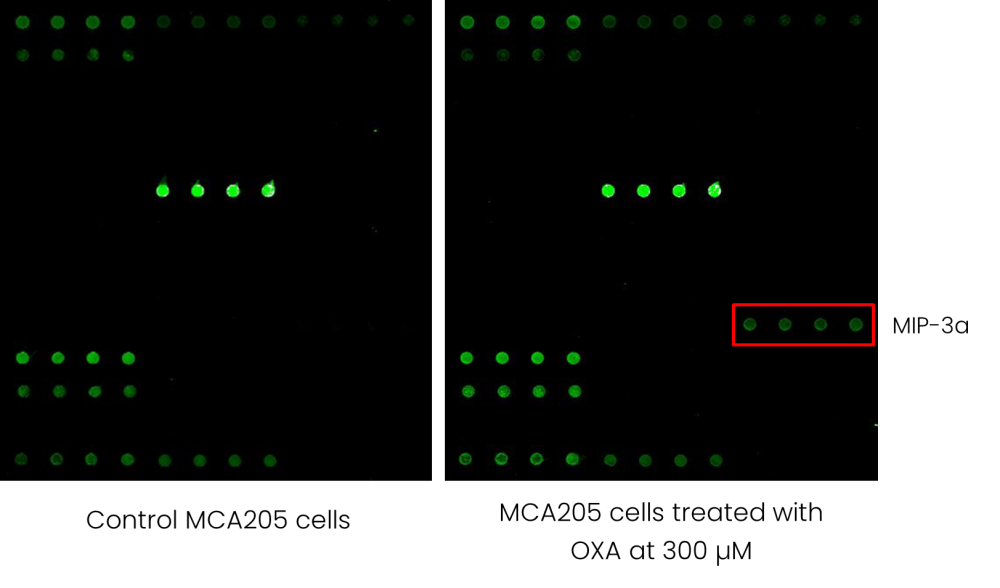 Figure 1 - Example of a multiplex antibody array indicating the oversecreted MIP-3a by OXA-treated MCA205 cells.
To analyze the molecular profiles in OXA-treated and untreated cancer cells, we utilized principal component analysis (PCA) and heatmap visualization (Figure 2). The PCA plot reveals distinct clustering patterns between OXA-treated and untreated cancer cells. The heatmap highlights the expression patterns, allowing for the identification of molecular features potentially influenced by OXA treatment.
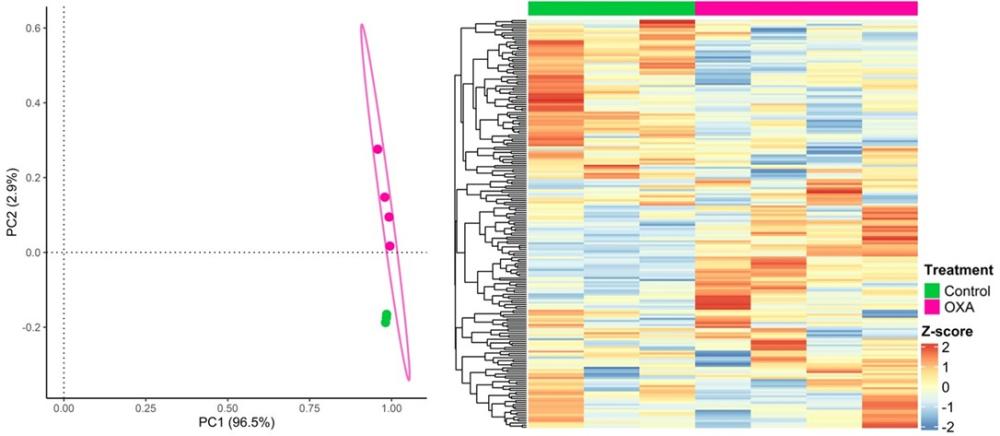
Figure 2 – Data profiling of the biomarker expression in OXA-treated and untreated MCA205 cells.
Left – Principal Component Analysis (PCA) comparing two groups of samples, OXA-treated (pink) and untreated cells (green).
Right - Heatmap displaying biomarker expression profiles of OXA-treated (pink) and untreated cells (green).
To identify biomarkers showing significant changes between OXA-treated and untreated MCA205 cells, we conducted a differential expression analysis using t-tests, revealing 47 differentially expressed biomarkers, including MIP-3a (Figure 3).
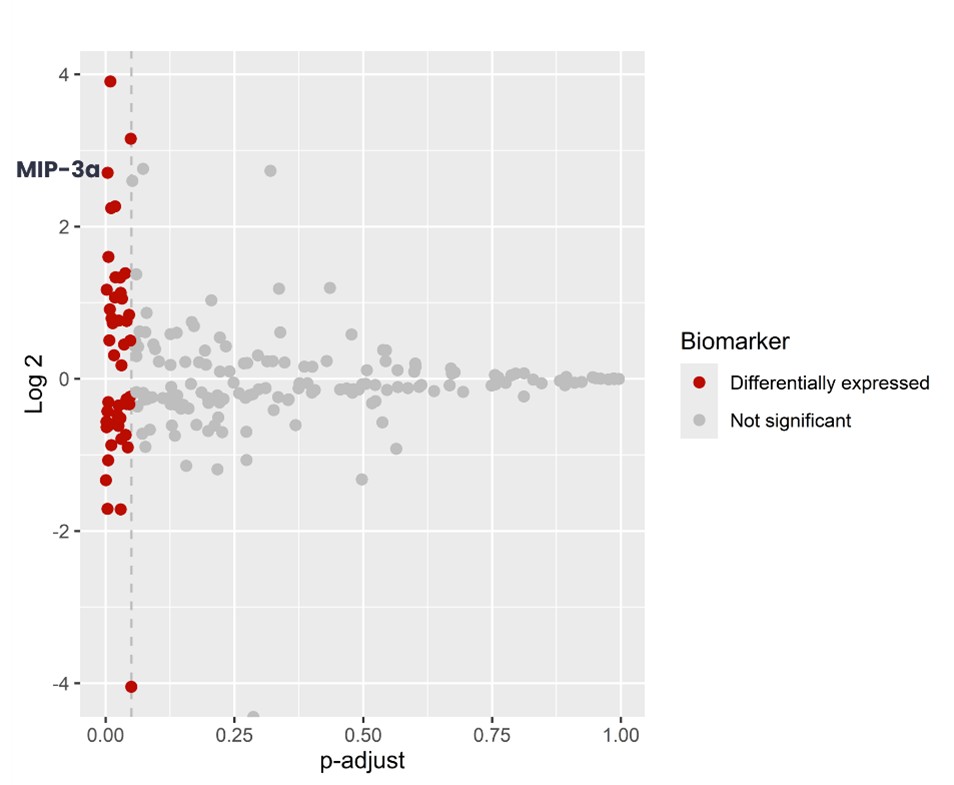
Figure 3 – Volcano plot illustrating differentially expressed biomarkers between OXA-treated and untreated MCA205 cells.
Each point represents a biomarker, with red indicating significantly differentially expressed biomarkers, and gray indicating non-significant changes.
Following the identification of differentially expressed biomarkers, we performed Gene Ontology (GO) enrichment analysis to elucidate the biological processes and pathways associated with these biomarkers. This analysis uncovered enrichment of 12 biological processes terms related in particular to cell death (Figure 4)
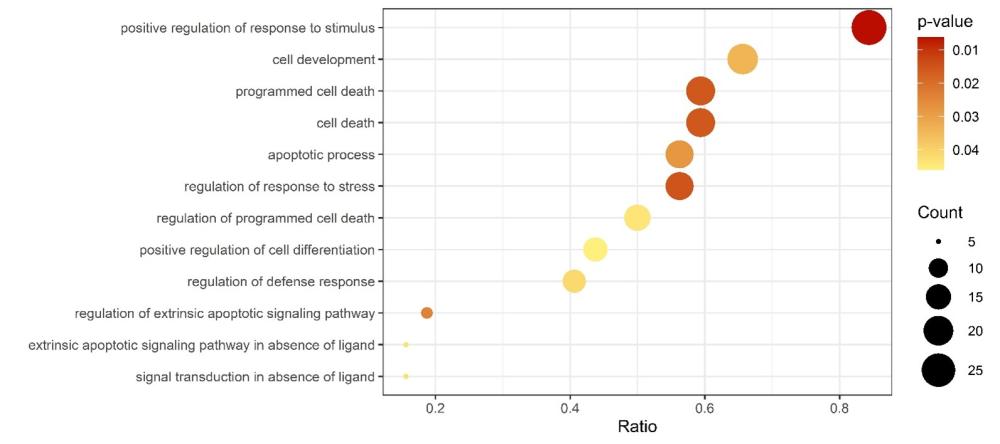 Figure 4 – Dot plot displaying Gene Ontology (GO) terms enriched among the differentially expressed biomarkers.
Each dot represents a GO terms, with the size indicating the number of biomarkers associated with the term, and the color representing the statistical significance of enrichment.
Conclusion
The analysis of the effect of OXA on mouse fibrosarcoma cells by using the mouse cytokine array GS4000 and subsequent biostatistical analysis of involved biological processes and pathways confirmed its role of ICD inducer in cancer cells.
Our high-density array offer allow us to quickly analyze biomarkers across 8000 human, 2808 mouse, 1500 rat, 50 porcine, 30 bovine, or 500 rabbit proteins.
-
References
[1] A. Showalter, et al. Cytokines in Immunogenic Cell Death: Applications for Cancer Immunotherapy. Cytokine. 2017 September ; 97: 123–132.
-
Authors
Marie Morin, PhD – Mélanie Sapateiro - Maxime Rochet - Alexandra Foucher – Eric Mennesson, PhD
-
Affiliation
Tebubio - 39 rue de Houdan, Le Perray en Yvelines, France
Custom Solutions for Biomarker Mapping and Data Analysis
Leverage our expertise in biomarker mapping and data analysis for your research. Contact us for a tailored approach and personalized quotation.